Mapping the effects of travel fatigue on performance metrics across racing, team, and individual sports wagering scenarios
Carlo Powell · Aug 24, 2026
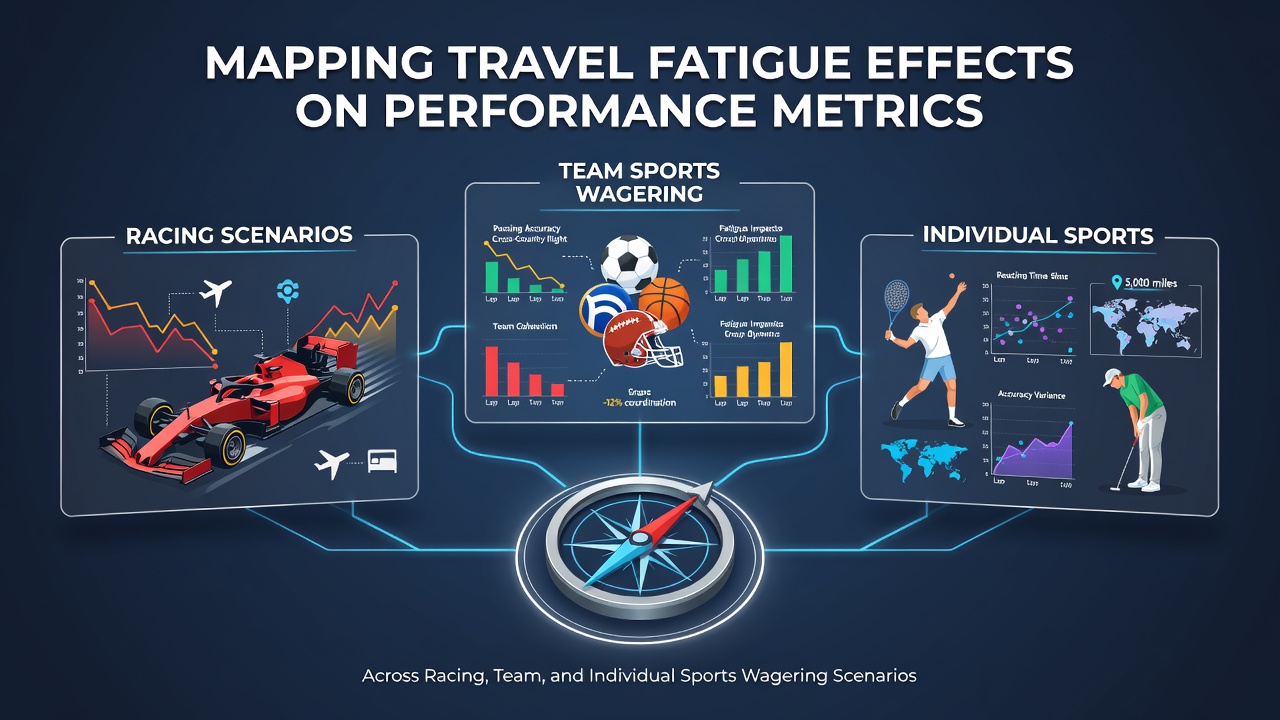
Mapping the effects of travel fatigue on performance metrics across racing, team, and individual sports wagering scenarios
Travel fatigue emerges as a measurable factor that alters performance metrics in racing formats, team competitions, and individual events, and those involved in wagering scenarios track these shifts to adjust predictions accordingly. Studies compiled by the Australian Institute of Sport show that athletes crossing multiple time zones experience disruptions in sleep patterns, hydration levels, and reaction times that persist for several days after arrival. Data collected during the 2024-2025 international seasons revealed average declines of 3 to 7 percent in key output measures such as sprint speed and endurance thresholds when travel exceeded eight hours without adequate recovery protocols.
Performance shifts in racing disciplines
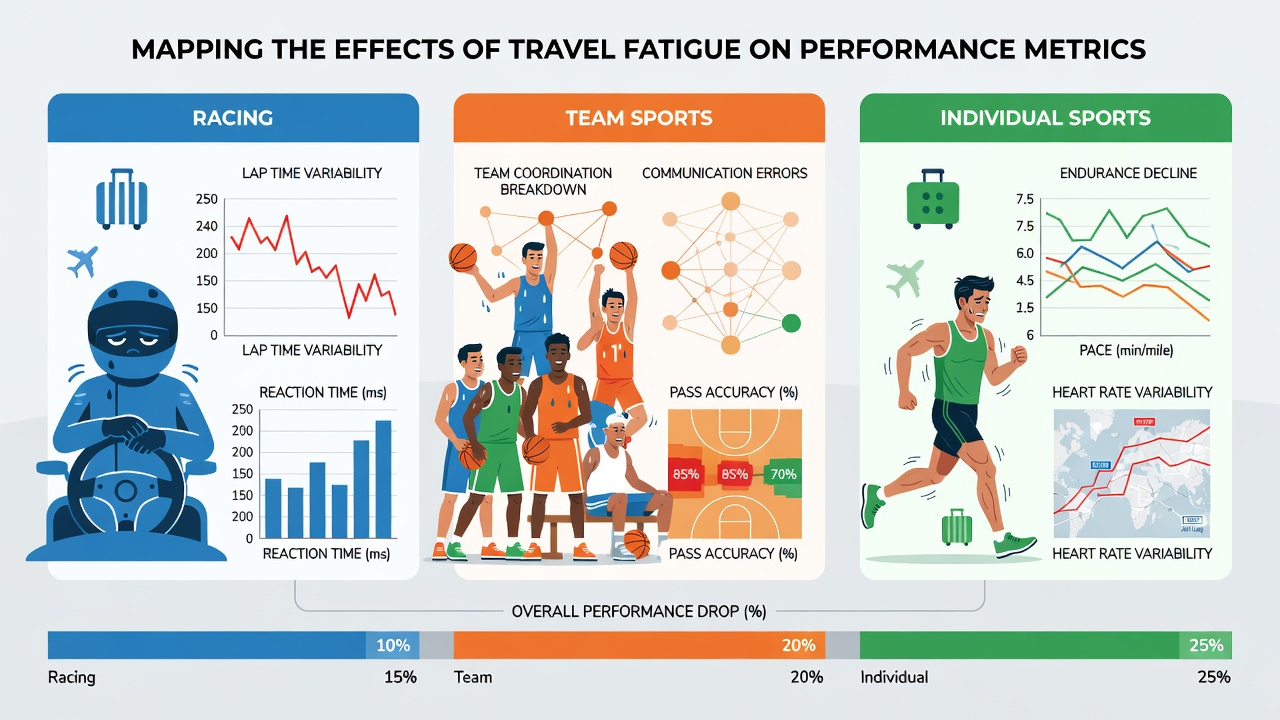
Racing environments, whether equine or motorsport, register distinct responses to long-haul journeys because both human and animal participants rely on precise coordination and recovery windows. Researchers tracking thoroughbred events across continents noted that horses arriving from Europe to Australia in the southern hemisphere summer posted slower sectional times in the first two starts, while driver reaction metrics in endurance races dropped measurably after transcontinental flights. A 2025 report issued by the Fédération Internationale de l'Automobile highlighted that pit-stop execution accuracy fell by roughly 4 percent in events following trans-Pacific travel, prompting teams to incorporate additional acclimatization days into schedules. Observers note that these patterns repeat across seasons, allowing analysts to factor cumulative travel distance into baseline expectations for upcoming fixtures.
Team sport outcomes and recovery timelines
Team-based competitions present layered variables because collective performance depends on synchronized rest cycles among multiple athletes. Basketball and soccer squads traveling between North American and European venues during the 2025-2026 campaigns recorded higher rates of late-game errors and reduced shooting percentages when rest intervals dropped below 72 hours. Figures released by the NCAA in mid-2025 indicated that conference teams crossing three or more time zones posted win percentages approximately 6 points lower than home-stand averages during the opening month of the season. Those monitoring these trends often cross-reference travel logs with injury reports to identify clusters where fatigue compounds existing workload demands. What's interesting is how recovery interventions such as light training sessions and controlled light exposure can compress the adjustment period, yet implementation varies widely across leagues.
Individual sport metrics and consistency patterns
Individual athletes face isolated accountability for results, making travel fatigue effects more visible in granular statistics such as serve accuracy in tennis or lap consistency in swimming. Data aggregated by the International Tennis Federation across 2025 Grand Slam events showed that players arriving from the opposite hemisphere recorded first-serve percentages that declined by an average of 5.2 points in their opening matches. Similar patterns appear in combat sports where weight management and reaction drills suffer when circadian rhythms remain unsettled. Analysts examining these cases frequently combine travel history with historical head-to-head records to refine projections, particularly when events cluster within short calendar windows during August 2026 schedules. The reality is that athletes who maintain strict pre-travel sleep protocols demonstrate smaller deviations from personal benchmarks, although the extent of mitigation differs by age group and prior exposure to frequent long-haul travel.
Wagering scenario adjustments
Wagering markets incorporate travel-related performance data through updated odds models that weigh recent itinerary details against venue familiarity. Industry reports from the European Gaming and Betting Association indicate that bettors who integrate fatigue indices into their evaluations adjust stake sizing on underdog selections when visiting teams or athletes face compressed recovery periods. Performance databases maintained by academic research groups at universities in Canada and New Zealand supply standardized metrics that quantify expected output drops, enabling more precise line movements in both pre-match and in-play formats. Those reviewing historical betting volumes note increased activity around fixtures that combine long-distance travel with minimal rest, because these conditions generate measurable variance in final margins and scoring totals. And because regulatory frameworks in multiple jurisdictions now require transparent disclosure of data sources used in odds compilation, market participants gain clearer visibility into how travel factors influence implied probabilities.
Conclusion
Mapping travel fatigue across racing, team, and individual sports continues to refine performance forecasting tools used in wagering contexts. Aggregated datasets from multiple continents demonstrate consistent directional impacts on speed, accuracy, and endurance metrics, while recovery protocols offer partial mitigation that varies by discipline and athlete cohort. As schedules evolve through 2026, continued collection of itinerary-linked statistics supports more granular adjustments in predictive models without relying on subjective interpretation.